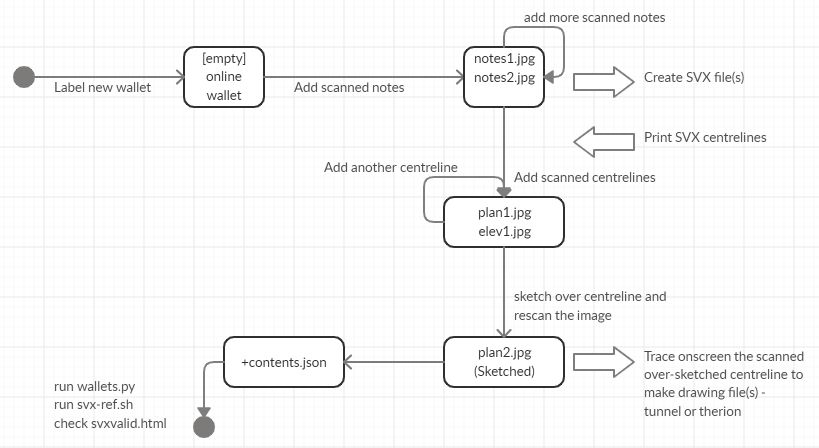
This "activity" diagram was created online using the free software at https://app.creately.com/
You can edit your own version to revise this when it becomes outdated.
We also have a "sequence diagram which shows clearly the sequence of wallet actions in a time-line.
[UPDATE: The bit in the lower left corner is out of date. We don't use wallets.py or svx-ref.sh any more. Those capabilities are now built into troggle itself (since July 2022).]
Both "activity" and "sequence" diagrams are part of the UML software specifiction system. We also have a "class" diagram for troggle. That page also defines the "essential", "specification" and "implementation" levels at which troggle is designed and maintained.
Statecharts are a standard diagram in the analysis of complex systems. They are used by the more professional analysts when planning a new software system. They are not quite the same thing as a finite state machine:
"The Statechart diagram is one of the five UML diagrams used to model the dynamic nature of a system. They define different states of an object during its lifetime and these states are changed by events. Statechart diagrams are useful to model the reactive systems. Reactive systems can be defined as a system that responds to external or internal events.
They were devised by David Harel, Weizmann Instiutute, in his paper: Statecharts: A Visual Formalism For Complex Systems Science of Computer Programming 8 (1987) 231-274. Or for a quicker cheat-sheet, see Paper; Didn't Read - Statecharts