User:Footleg
From Fs_wiki
Contents |
Tutorials todo list
- Pitch undercuts page
- Finish One Quick Example tutorial
User Questions
Defining Styles
(Was 'Boulder Layout')
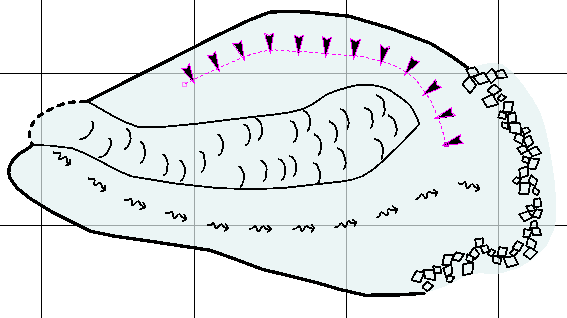
Julian: Boulder packing in thin areas is not that great yet. Put in what you want and we'll see about improving the layout later. The experimental symbol types are "neck..." and "flowperp" and "flowpara". The following diagram has four symbols in it.
They're available in Subset style: base1000, which you will be able to get to by changing the "groupsubsetselectable="yes"" below in the fontcolours.xml. Then update areas, relay symbols, and you will see them.
Footleg: What is the method by which the fontcolours XML documents are located? I noticed that the document in the inlet7 example folder has 'inlet7' in the filename, but I could get a copy to load from my own survey directory which was just called fontcolours.xml
Julian: When you "open XML dir" it recurses through every directory and file looking for stuff that has the <fontcolours> tag in it. Primitive symbols all have to be in the symbols directory, but this could be changed. Tying the symbols and fonts to these styles makes it possible to render the same cave to many different scales.
The XML attributes are recursive -- if the right attribute is missing from a particular record, it searches upwards in the XML tree, giving the appearance of a more hierarchical file than it actually is. So:
<linestylecol linestyle="detail" strokewidth="2.0">
is EXACTLY equivalent to:
<garbage linestyle="detail" strokewidth="100.0">
 <linestylecol strokewidth="2.0">
</garbage>
I don't know if this is standard XML use, but it's pretty versatile.
Connective lines to centreline
Footleg: I notice that the example surveys all join the survey centreline nodes to the walls using connective lines. Is there a reason for this? I thought that maybe these would be generated automatically from the LRUD data if I imported some from a survey, but I cannot see how to do this.
Julian: If you're tracing a cave drawing, then it's too late for including LRUD because it won't match the pencils. This binding the survey drawing to the centreline like a backbone is key to why Tunnel still works once you have imported a hundred surveys on top of each other in a great big mess. I agree that intuitively it looks like it should be done automatically, but it doesn't take much time and is too important to leave to a computer to get wrong.
- Footleg: So I need to manually create these connecting lines from my stations based on the Left and Right measurements which presumably I would have on my hand made survey sketch (printed along with the centre line which I generated from survex)? For my current project I am digitising an old (1960's) line drawing of a cave for which much of the original survey data has been lost, so I have no LRUD data. The centre line data has been taken off the line drawing for much of this, so I am sketching around this, and then distorting the survey to match some later resurvey data for some passages. Eventually I will be adding new passages which I will have full survey data for, so I want to be sure I understand the process for getting from the raw survey notes, via survex, doing a pencil sketch and then scanning that in and drawing it up in Tunnel.
- (I've added some notes on the importance of connective lines at Tracing the Image )

